Back to Help on the WebTables System
Using the Advanced Interface to Plots and Tables
You can get the most flexible definition of plots and tables through the
Advanced Interface to Plots and Tables.
It takes more keystrokes to define a plot from this interface than from the
Simple Interface,
but many more options are available including:
- a larger selection of data names
- more options for forming ratios
- more options for range selections
- multiple ranges
- more options for grouping
- multiple grouping
Step 1: Select data names
Initially, what you see is:
You may select one or more data names at a time.
Most browsers handle multiple selection by having you first click on
one item, then click on another one while holding the shift or control keys.
Once you have added at least one item,
a new scrolled list appears at the right showing what you have added
and a remove button appears at the bottom of the button bar.
You can also simply undo your work step by step by using your browser's
"back" button.
Step 2: Supply at least one range
If you select an item from the left and then select "add as range",
you are given a range selection form such as
Select the button next to either
"Between", "Last", "Equal to" or "Includes"
then fill in the appropriate values and hit "enter as range."
"Includes" searches for all rows where the given element contains the given
string.
For example, to find CATER Reports whose description includes the word
magnet, such as
"The magnet failed due to a water leak."
set up the range as:
Step 3: Optionally, select grouping
You have the option of selecting "add as group by" rather than
"add as new column."
The data returned will then be grouped by the specified element.
All rows that have the same value of the "group by" element will be combined.
- For columns of numeric data, the numbers will be summed.
- For columns of non-numeric data:
- if rows in a given group are the same, that common value will be displayed
- if the rows in the group are different, the word "various" will be
displayed
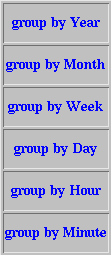
If you group by a data name that is a date or time,
you will be asked how you would like the data binned.

Step 4: Submit the request to make a Plot or Table
Once you have specified at least one range and have specified at least
one data name to plot or tabulate,
three new buttons appear at the bottom of the button bar.
Check that you have chosen the appropriate option for
how to handle invalid data
and then submit the request.
Joseph Perl
and
The Run Information Group
Last Updated: 10 July 1997
