This section of the workbook covers debugging both at compilation time
and at run time.
It assumes you have a copy of the example routine WBPREP1.PREPMORT
discussed in the previous section.
Debugging the Compilation
There are two different commands which can be used to compile Prepmort.
The new command, EXPEDITE,
does not have as many features for debugging the compilation as
the old command, PREPMORT.
Therefore, users who have trouble debugging their compilation may want
to try the PREPMORT command.
You will see the following list of options if you type HELP PREPMORT:
  /LIST[=file-spec]         D=/NOLIST
  /OBJ[=file-spec]          D=/OBJ
  /MLIST[=file-spec]        D=/NOMLIST
  /MFORT[=file-spec]        D=/MFORT
  /MORTRAN3                 D=/NOMORTRAN3
  /OPTIMIZE                 D=/OPTIMIZE
  /JBOUNDS                  D=/NOJBOUNDS
  /TIME                     D=/NOTIME
The first five options control how much output the Prepmort command leaves you.
The last two options, OPTIMIZE and JBOUNDS,
exist for both the PREPMORT and the EXPEDITE commands.
They control how the resulting code will run and
are discussed later in Debugging the Run.
By default, the compiler leaves behind two new files, a MORTFORT
and an OBJ.
To understand the other choices of files that the Prepmort command can leave,
it is helpful to know the actual sequence of events triggered by the
PREPMORT command.
PREPMORT file.
PREPMORT file and expands
certain Jazelle and Signal macros to create a MORTRAN3 file.
This output file is in the Mortran language.
MORTRAN3 file and expands
the Mortran macros to create both a diagnostic listing called a
MORTLIST file and an output called a MORTFORT file.
This output file is in the Fortran language.
MORTFORT file and compiles
it to create both a diagnostic listing called a LIS file and
an output called an OBJ file.
This output is in VAX or Alpha Machine language.
To see all of these stages of the compilation, run the PREPMORT
command with all of the output options set on.
> PREPMORT/MORTRAN3/MLIST/LIST WBPREP1
You can compare the PREPMORT, the MORTRAN3
and the MORTFORT to see how the original Prepmort file
was interpreted into Mortran3 and then into Fortran.
Normally, you only really need the starting and ending files of this
long chain. The PREPMORT is the original code and the
OBJ is the final result.
By default the MORTFORT is also saved because it is useful when
you are debugging the run.
When you have problems compiling a routine, then it is time to turn on the
options to save the MORTLIST or LIS.
MORTLIST shows information about how the Prepmort
pre-compiler ran.
It can be particularly useful for seeing what happened with nested brackets.
If you study the WBPREP1.MORTLIST, you will see an integer
in the left-hand column. This is the level of nesting.
You will see that it goes up to 1 when a bracket has been opened and goes
back to 0 when the bracket has been closed.
LIST shows information about how the Fortran compiler ran.
Try introducing a few typographical errors into the WBPREP1
Prepmort example file and recompiling.
Most error messages will appear at the console.
In rare cases, the compilation will fail to create an OBJ file
but will not give a useful error message at the console.
In such cases, the MORTLIST and LIS files will
usually be left behind for you.
Look for error messages summarized at the bottoms of these files.
More help on debugging Prepmort is available from
A Guide to SLD Mortran by Gary Bower, Richard Dubois and Mike Kelsey.
Debugging the Run
The VMS operating system contains an extremely useful symbolic debugger.
Users who come to VMS from the IBM VM operating system or from other
unfortunate operating systems may have long since lost faith in debuggers.
But with VMS, they should take another look at debugging.
The VMS debugger is excellent.
The debugger has two modes. In one mode, it creates a separate window for the debugging information. In the other mode, it fits all of its information into the same window that your IDA program is running in.
The debugger will normally use the first mode (the multi-window mode)
unless it cannot figure out how to open additional windows on your screen.
This problem occurs when you have used SET HOST or
TELNET to create the window where you are running your
IDA session.
If this occurs, use SET DISPLAY
to tell what display to use.
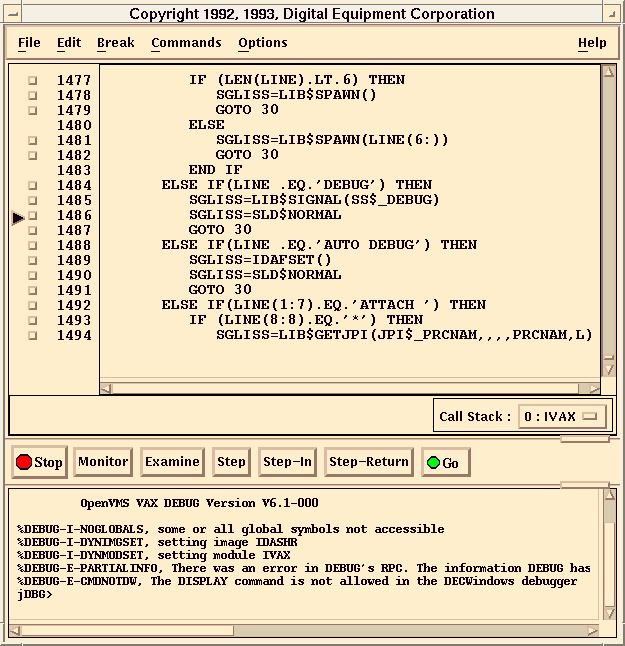
You can enter the debugger at any time while you are in IDA. From the IDA prompt, just type DEBUG. Try it now.
You should see something like the following:

MORTFORT that you saw
earlier when we were telling you about the output of the PREPMORT
command.
Typically, you use the debugger by setting a break point on a particular routine. When you then call that routine from IDA, control goes to the debugger and the debugger lets you step through the routine and examine various quantities.
As an example, we will use the debugger to watch our new routine
WBPREP1 in action.
We can not set the break point on WBPREP1 right away because
IDA has not yet loaded the routine.
As we mentioned earlier, IDA does not load our shareable image until it is
actually needed. So we first need to return to IDA and load our code.
Return program control to IDA by clicking in the Go button.
Load our code by issuing the IDA command EXTERNAL WBPREP1
Enter the debugger again by typing DEBUG
We start by telling the debugger which shareable image we are currently interested in.
SET IMAGE WBPREP1SHR
Next, we tell the debugger to load all of the symbol information for the
current shareable image.
SET MODULE/ALL
Do not worry if you get the response:
%DEBUG-W-SCRNOSRCLIN, no source line for address 001C338F for display in SourceViewSet Module is just complaining that it can not find the source code the the particular obscure section of code that is currently active in IDA.
The debugger should now have enough information loaded that it can set any break point that we wish in our shareable. To set a break on the start of our routine:
SET BREAK WBPREP1\WBPREP1
The reason the name WBPREP1 is repeated twice is that the command actually
needs you to specify Module_name\Routine_name.
It just happens that the way we use Fortran in SLD, the module name and
the routine name are always the same.
Now hit the Go button to return control to the IDA window.
If you now run some IDA commands that cause WBPREP1 to be called,
the debugger will wake up when WBPREP1 is called.
Try it now.
   Ida>  OPENTAPE READ REC94_MDST STAGE WAIT

   Ida>  DEF EVANAL
   Ida>    CALL WBPREP1
   Ida>  ENDDEF

   Ida>  GO 5
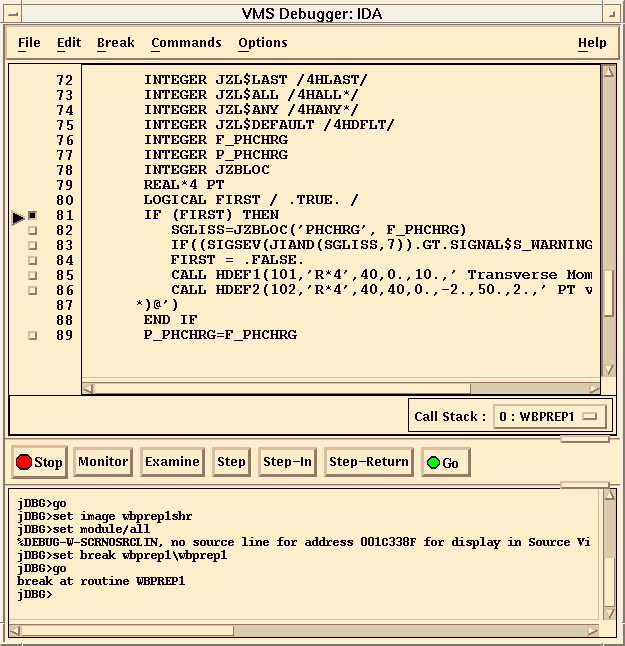
The debugger should now show part of the routine WBPREP1.
The arrow shows the line that is about to be executed.
It should be on the IF (FIRST) THEN statement.

You can step through the routine one statement at at time by using the Step button. Try it a few times.
If you are running on an Alpha, the Alpha's high level of optimization may
result in the code stepping around in a way that doesn't seem obvious.
You can, if you like, turn off this optimization by quitting and recompiling
WBPREP1 using the PREPMORT command's
/NOOPTIMIZE option.
Then remake the shareable, start IDA and get back to this point in the debugger.
You can step more than one line at a time by typing the command
STEP followed by some number.
To examine the current value of any variable, just highlight it by clicking and dragging the left mouse button, then hit the Examine button.
Sometimes you may get a response telling you that a variable
"does not have a value at the current PC (was optimized away)."
This means that the compiler's optimization system replaced this symbol
with another construction at compilation time.
If you really need to examine this variable, recompile the code using the
PREPMORT command's /NOOPT option.
Then remake the shareable, start IDA and get back to this point in the debugger.
If you hit the Go button, the debugger will go back to sleep until this routine is again called. Since you told IDA to GO 5 events, this routine will in fact be called again very soon. The debugger will then wake up again at the top of the routine.
There are many ways to turn off the break point. You will need to study the debugger's built-in help system to learn them all. A simple one to turn off all break points is to type:
CANCEL BREAK/ALL
You can set a break point on a particular line of the routine rather than the top of the routine. For example:
SET BREAK %LINE 101If you then Go, the debugger will stop at line 101.
Look at the built-in help system when you are ready to learn more about the VMS debugger.
INDEX,
PEEK and POKE from within the debugger,
that is, without having to return to the IDA prompt.
But before doing this, you must first type the following command
from the debug prompt:
@PRODJAZELLE:JAZELLESHR.DBGCOMYou will get the response:
The DISPLAY command is not allowed in the DECWindows debuggerYou can ignore this response. The command actually worked.
The debugger will then understand the Jazelle commands. This means that you can type Jazelle commands either from the IDA prompt or from the debug prompt. In either case, Jazelle's responses will appear not in the debug window but in the IDA window.
The proceeding command assumes that you are running from Shareables.
Users who run from the older system, using BUILD,
should skip the @PRODJAZELLE:JAZELLESHR.DBGCOM.
EXITIf you are in IDA and you try to end the session by typing QQUIT, you will find that the debugger is woken up one last time. Tell the debugger
EXIT
Study the built-in help system to learn more about the VMS Debugger (select "On Commands" from the Help menu at the top right corner of the debugger window).
EXPEDITE, and the old compile command
PREPMORT have options that can help with
debugging how the code runs.
These options are:
  /OPTIMIZE                 D=/OPTIMIZE
  /JBOUNDS                  D=/NOJBOUNDS
The effect of these options is as follows:
As an example, look at the following code. Assume that a Jazelle bank called MYBANK contains an element called MYARRAY that is an array with room for eight values: REAL*4 MYARRAY(8). If your code ever tried to write a ninth value into this array, you would be overwriting the Jazelle boundaries.
     DO I = 1, 9
     [
       P_MYBANK%(MYELEMENT(I)) = 99.;
     ]
If the code was compiled with the option JBOUNDS, the Prepmort pre-compiler
would add code to check the value of I before filling MYELEMENT(I).
Then, when the code was run, an error message would be issued when this
DO loop tried to fill MYELEMENT(9).
Since checking JBOUNDS takes time, the default is not to do this check. If you are concerned that your routine is failing because of overwriting, recompile your code with the JBOUNDS option. Then, once you have found and fixed the problem, compile again without the JBOUNDS option to make your code run fast.
SET LANGUAGE command to select C or Fortran,
whichever is the source language of the code you are currently debugging.
This will allow you to use most of the usual language constructs in
debugging commands.
For example:
     SET LANGUAGE C
          or
     SET LANGUAGE FORTRAN
When setting a break point on a C routine note the following.
If the C file contained more than one routine, the module name and the
routine name may not be the same.
Thus rather than saying
SET BREAK ROUTINE_NAME\ROUTINE_NAME
you may have
SET BREAK MODULE_NAME\ROUTINE_NAME