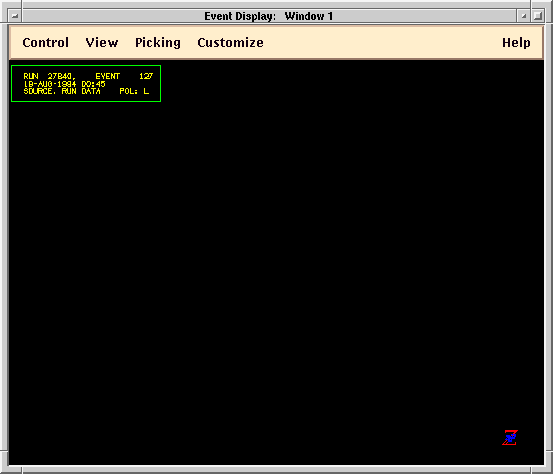
There will be a wait of up to a full minute before you see results. This is because IDA is busy initializing the Event Display. Eventually, the cursor will return to its normal shape and you will see a new window, the Event Display Window.

Initially, the Event Display Window is empty except for the event information box and the SLD Z logo. This is just the same as when you first did a DSP DRAW from the standard IDA Event Display interface.
To draw anything more, you need to tell the Event Display system what display objects you want to see.
Select "Objects..." from the Event Display Window's Control menu.
You should see a new window:
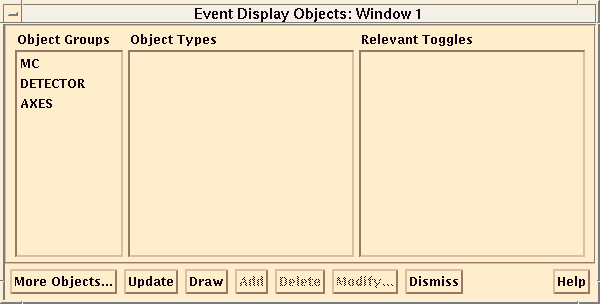
First try adding some Detector objects. Select "Detector" from the Object Groups box.
The Object Types box will then show all of the event display object types in the "Detector" group.
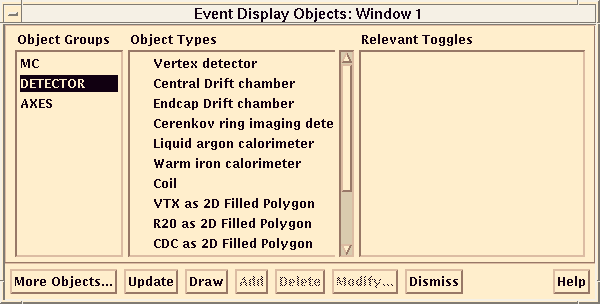
To select any of these object types, click on them and then hit the Add button. Or just use double-click. A mark at the left of the Object Type name indicates that the object has been added.
Once you have added the objects you are interested in, hit the Draw button. The relevant objects will be drawn in the Event Display Window.
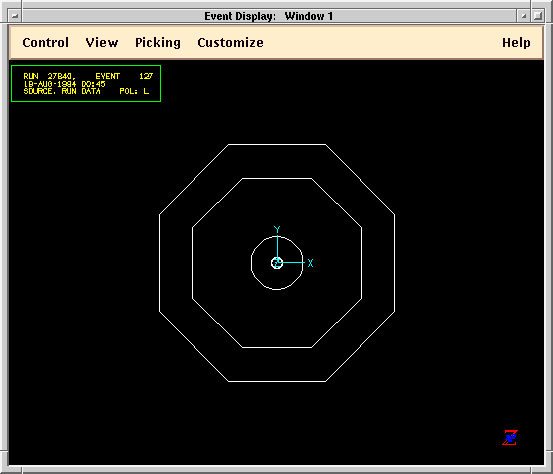
For now, add the Warm Iron Calorimeter, the Central Drift Chamber and the Vertex Detector. And from the "Axes" object group, add the Cartesian coordinates axes.
When you hit the Draw button, you should see a display as follows:
So far, we have only added detector object types. To add some object types related to our physics data, first hit the "More Objects..." button.
You should see a new dialog box, the "Event Display Userdata" box. Recall how when you learned about the Event Display you had to use the DSP USERDATA command to load additional optional pieces of event display code. This dialog box lets us control that function.
We want to load the Mini-DST piece of the event display code. Click on the MDST button in the "Event Display Userdata" box.
There will be a delay while the new code is loaded and initialized. The rectangle around the MDST button will go away once this is done.
Note that you do not get the helpful clock cursor in the Event Display Windows to tell you when MIDAS is busy. This clock cursor, unfortunately, is only available in the IDA Main Window. If you are confused about whether MIDAS is ready for your input or is busy, set the cursor back into the IDA Main Window and see if it is a clock shape.
This is just a case of something that is not yet finished in MIDAS. Eventually, the goal is to have the clock cursor available in all windows.
Once you have selected the MDST code, you should see some new Object Groups in the Event Display Objects Window.
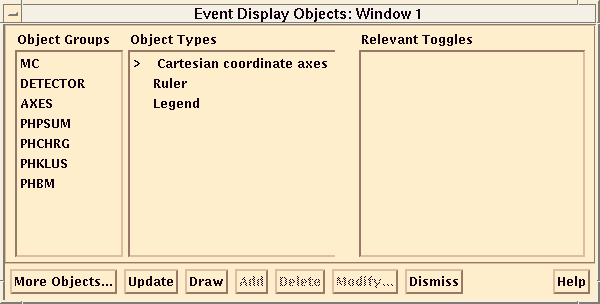
From the "PHCHRG" object group, add the object type PHCHRG: Tracks.
From the "PHKLUS" object group, add the object type PHKLUS: Clusters.
When you now hit the Draw button, you should get a display like the following (though you may be on a different event than we were when we recorded this picture)
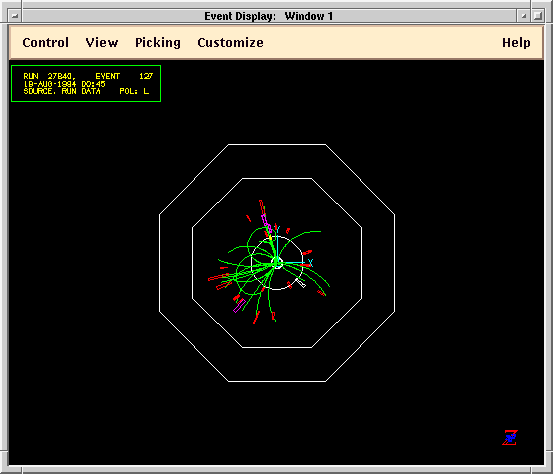
Just as the histogram windows update when you hit the GO 1 button in the IDA Main Window, the event display windows also update. For added convenience, the Event Display Window's Control menu has a duplicate of the IDA Main Window's GO 1 button.
Try using GO 1 to look at other events.
There is a "Modify..." button in the Event Display Objects Window. If you select an object type (try one of the detector object types), then hit the "Modify..." button, you will get into a dialog box that lets you modify the drawing options such as color and line style.
Now try some of the view control features of this system. From the Event Display Window, select "Zoom..." from the View menu.
You should get a slider from which you can control the display zoom. When you slide the slider, the zoom changes.
Other sliders are provided for the view Phi and Theta.
You can have more than one event display window at a time. Select "New View" from the Event Display Window's Control menu. A new copy of the event display window will appear on top of the old one. If you drag it aside you will see that you now have two event display windows.
Initially, the new event display window is just like the old one, but any later event display options will change one window without affecting the other.
You can use this feature to have, for example, one window showing a zoom in on the vertex system while another window shows a wide view of the whole detector. When you GO 1, all displays update to show the new event.
The Event Display Window contains a Picking menu. This menu controls what happens when you click on data in the event display drawing itself.
Select "PEEK" from the Event Display Window's Picking menu.
If you then click on a track in the display, you will see a dump of the relevant PHCHRG bank's contents in the display's information box.
There are a few advanced Event Display features that have not yet had MIDAS menu items created for them. You can access these features by turning on "Show Old Style Menus" from the Event Display Window's Customize menu. These are the same menus that you may have seen on the SGI, RS6000 or IBM 5080 3D interactive workstations.
A particularly useful feature you can access this way is to control the detailed detector geometry. Try this now as follows.
First go to the Event Display Objects window, select the "More Objects..." button and select "GEANT". The GEANT code will take a while to load. You will then have a detailed geometry package loaded that you can control from the "Old Style Menus."
Go to the Event Display Window's Customize menu and turn on "Show Old Style Menus."
A set of menus will appear the left side of the display. Click on "Detector Geometry Menu."
You will get a picture as follows:
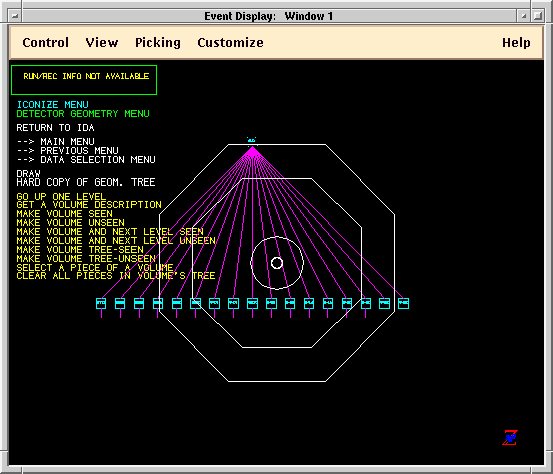
The image shows the geometry of the detector in a hierarchical form. The top box represents the whole of SLD. Each of the boxes below represents a detector subsystem. If you click on one of the boxes that has a line below it, the display will redraw to show more detail in the given subsystem.
You can go back up the tree by clicking on "Go Up One Level."
Geometrical volumes drawn with a solid box are set to be seen. Volumes drawn with a dotted line are set to not be seen. You can change these selections by first selecting a menu item from the left ("Make Volume Seen" or "Make Volume Unseen") and then selecting a particular volume. The next time you draw that volume, the new options will be used.
Note that this system only controls the level of details to which a given detector subsystem will be drawn. You still have to make the overall decision about whether to draw that subsystem or not. You make that decision on the "Event Display Objects" window that you have already seen.
There are too many other features in the MIDAS Event Display subsystem to discuss them all here. Just try them.
Since the MIDAS Event Display subsystem is really just a convenient interface to the standard IDA Event Display, you may find useful information in the standard IDA HELP DSP.
You can also learn more details by using the MIDAS help menus.
Again, be warned. MIDAS has bugs. You may find ways to blow up the MIDAS session.