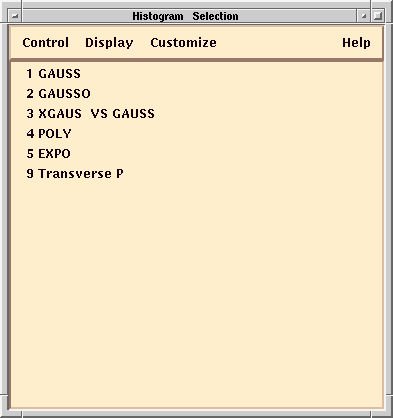
You should now see a new window, the Histogram Selection window.

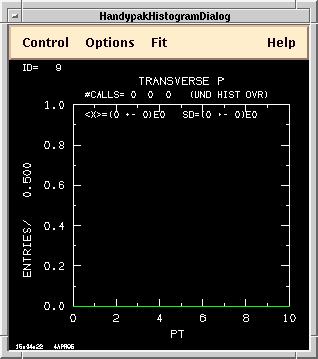
To display a histogram, click on its title and then select "All Selected" from the Display menu or just double-click on its title. For example, double click on the first one, "Transverse P."
You should see another new window, the Histogram Display window.

So far, this histogram will be empty since no events have been run through the Evanal that fills this histogram.
Hit the GO 1 button a few times a few times in the IDA Main Window and watch how the data accumulates into the histogram.
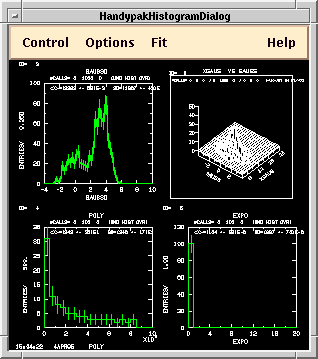
You can display several histograms in a single window by selecting more than one name from the Histogram Selection window. Do this by pressing the left mouse button down on the first one and then then dragging past all of the ones you want before releasing the mouse button. Then select "All Selected" from the Display menu.
If you do this for the middle four histograms, you should see the following:

You can have more than one Histogram Display window. Try selecting the first histogram (just a single click) and then display it by selecting "New Window" from the Display menu.
You should now have two different Histogram Display windows. Future actions in the Histogram Selection window will affect whichever Histogram Display window you clicked on last.
Before you go on to learn the next subsystem, set one of your Histogram Display windows to show the "Transverse P" histogram. Then set the Histogram Selection Window and Histogram Display Windows aside.
The MIDAS Histogram subsystem is really just an interface to the standard IDA histogram system. You may find useful information on using this system back in the earlier section of this Workbook, IDA Continued.
You can also learn more details by using the MIDAS help menus.